
Data visualization is useful for looking at data in a different way. One of the best ways to visualize your data is through the use of graphs and charts. FileMaker does have built-in ways of creating graphics and charts. However, there are a few key limitations. Native charts can only have up to 12 y-series on a single graph, and you can only create specific chart types and limited styling options. Using Google Charts resolves these issues by working as a JavaScript library that you can load into a web viewer. This allows you to dynamically gather the data you want to visualize and then pass it to a web viewer to be rendered.
To simplify this integration, we have created a method to streamline building charts. The demo file linked at the bottom of this article contains a solution that uses a table to allow users to create charts for different data sets. With a simple pop-up menu, the user can change the graph style they want to use to display their data. Users can also create custom CSS stylings for each chart. If you want more of an overview of Google Charts you can reference our other FileMaker Google Charts article.

How Google Charts Works
This integration uses a Google Charts table to store and build the HTML that will be given to the web viewer to render the chart. When you create a new record in the Google Charts table, it will auto-enter the HTML template for the header, footer, draw charts function, and Google Charts package.
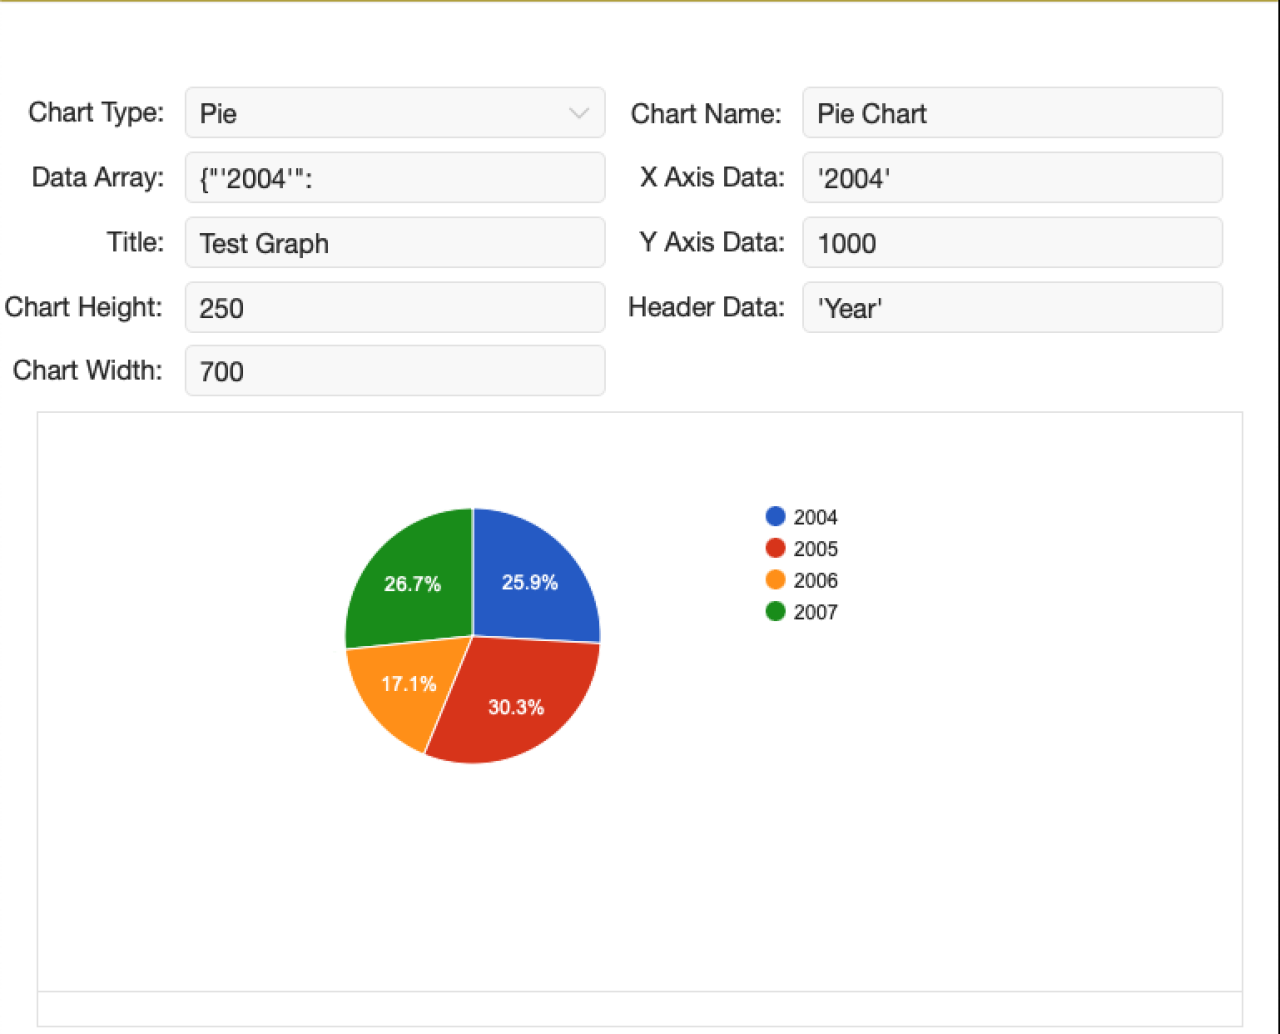
On the data entry screen, you can change the chart type, title, height, and width, and change or add data. When you commit your changes, the chart will reevaluate based on what you've entered and the rendered chart will display on the web viewer below the entry fields.
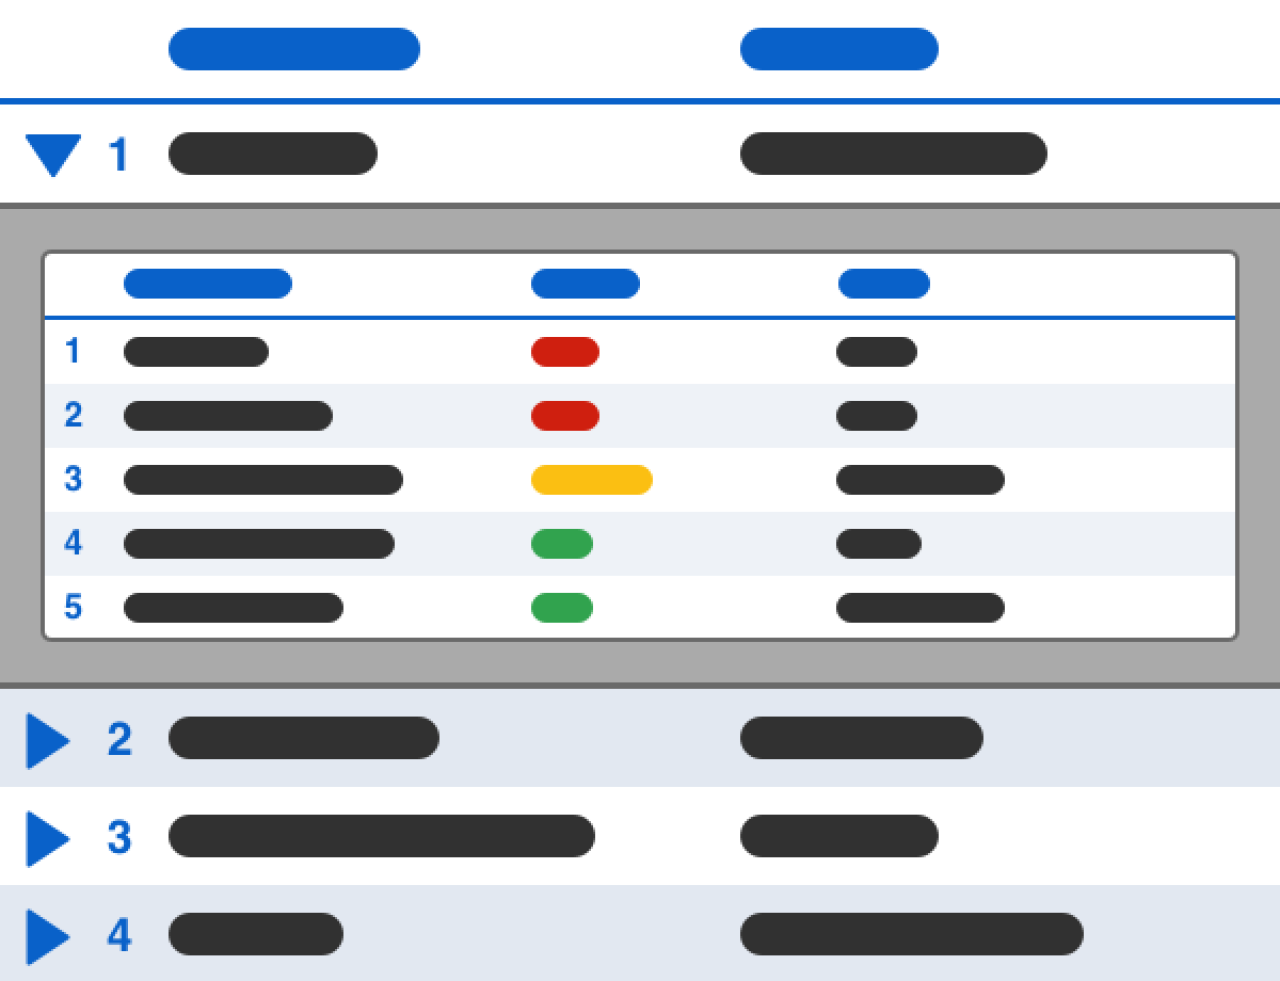
Google Charts data takes an array of data points where the first array is the headers for data, and the first index of each array is the x-value followed by the y-values at that x-value. Instead of needing to format your data to match what the chart expects, if you put a list of x-values, y-values, and headers into their corresponding boxes on the data entry screen, the system will automatically generate and populate the data array field with the proper formatting.

The y-values should formatted as in list form (y1v1, y2v1, y1v2, y2v2, etc.) so the system will correctly correspond them with their appropriate x-value. Now, we will demonstrate how to use these charts with your data.
Using Google Charts with Your Data
Create a new record in the charts table
Choose the Chart Type, Title, Chart Name, Height, Width
Place the web viewer on the layout you want the output to display
Get a list of x-values, a list of y-values, and a list of headers
Paste the values into the corresponding box and the chart will render
Using Google Charts Dynamically
To use the reports dynamically, you can create fields on a preferences layout that correspond to the name of the chart you want to use on that layout. You can enable them as pop-ups using the names of the charts you created in the Google Chart table.


Then, create a cartesian relationship from the table you want to display data from to the preferences table, like so:
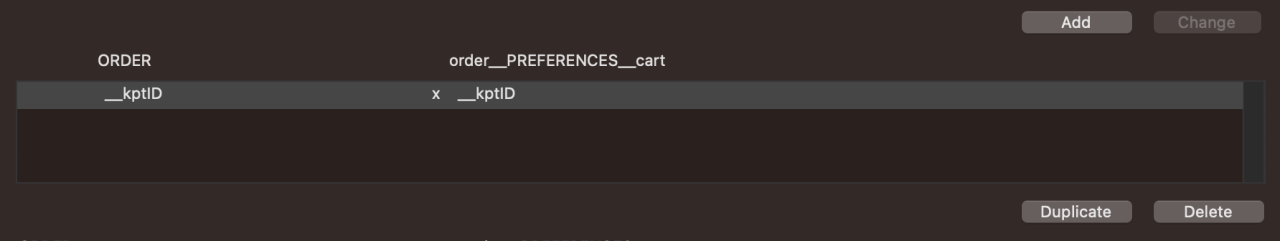
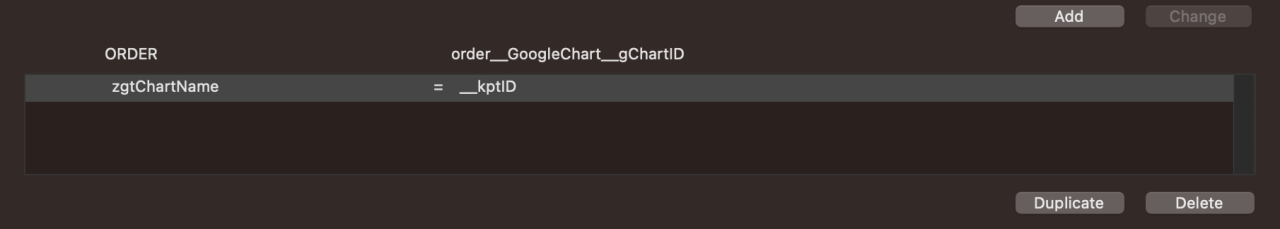
This will allow you to grab what chart to use for that report dynamically, so if it changes in the future, we won't have to change anything on the report layout. Next, create a relationship from your table with the data to the Google Chart table (in this example, we are using the order table):
Next, you'll need to create a script that gathers your data and populates the Google Charts fields. Below is an example of a script that generates a chart based on the quantity sold of each product on an order.
The first step is to grab the chart we want to use from the preferences table.
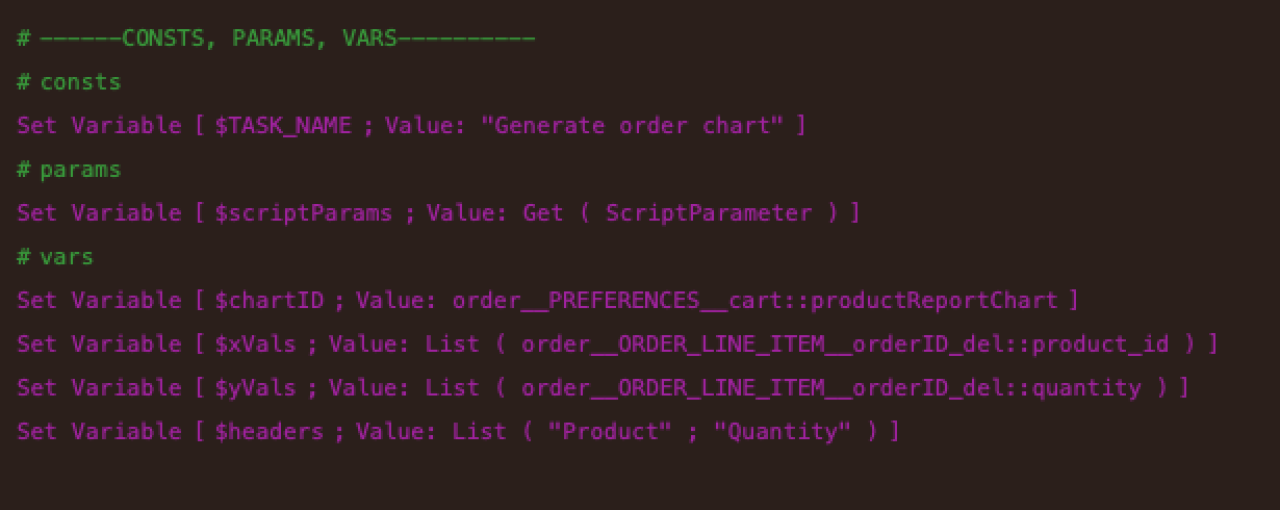
Then, set the global to the chart that we want.
Then gather a list of your x, y, and header data.
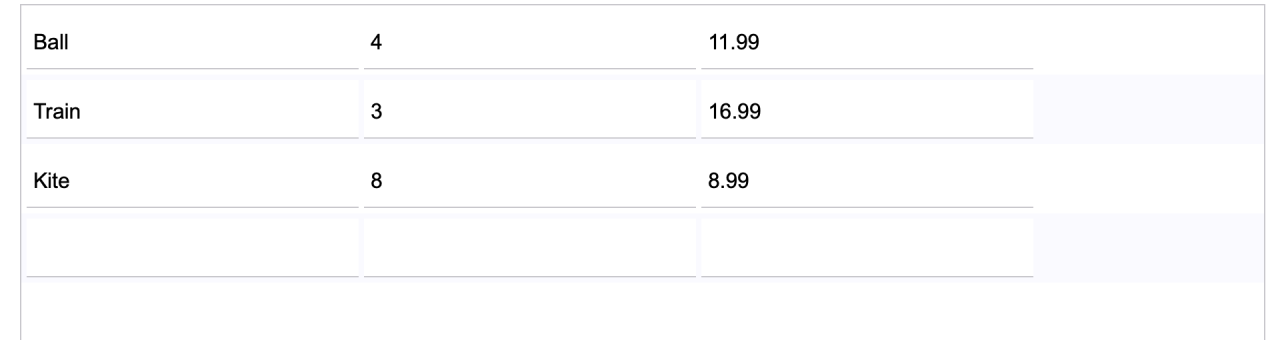
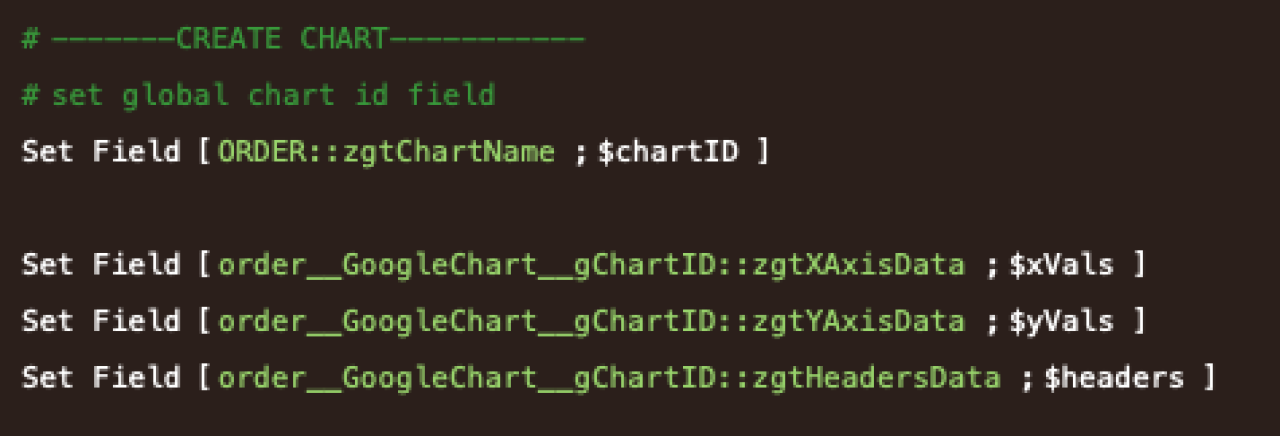
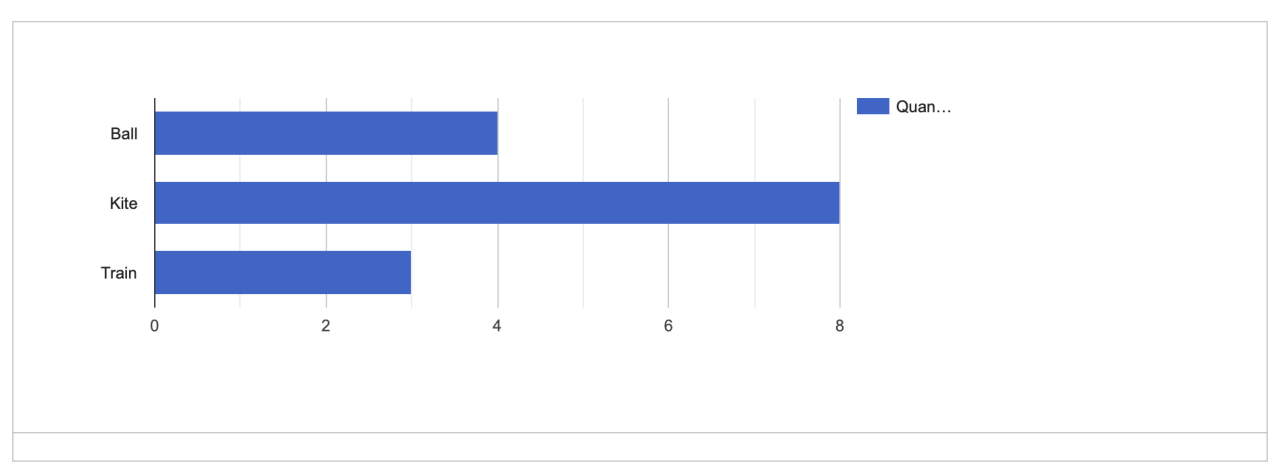
Set that chart's data values, and as soon as the commit happens, the chart will render on the web viewer. Using this as our product information, the following chart is generated.
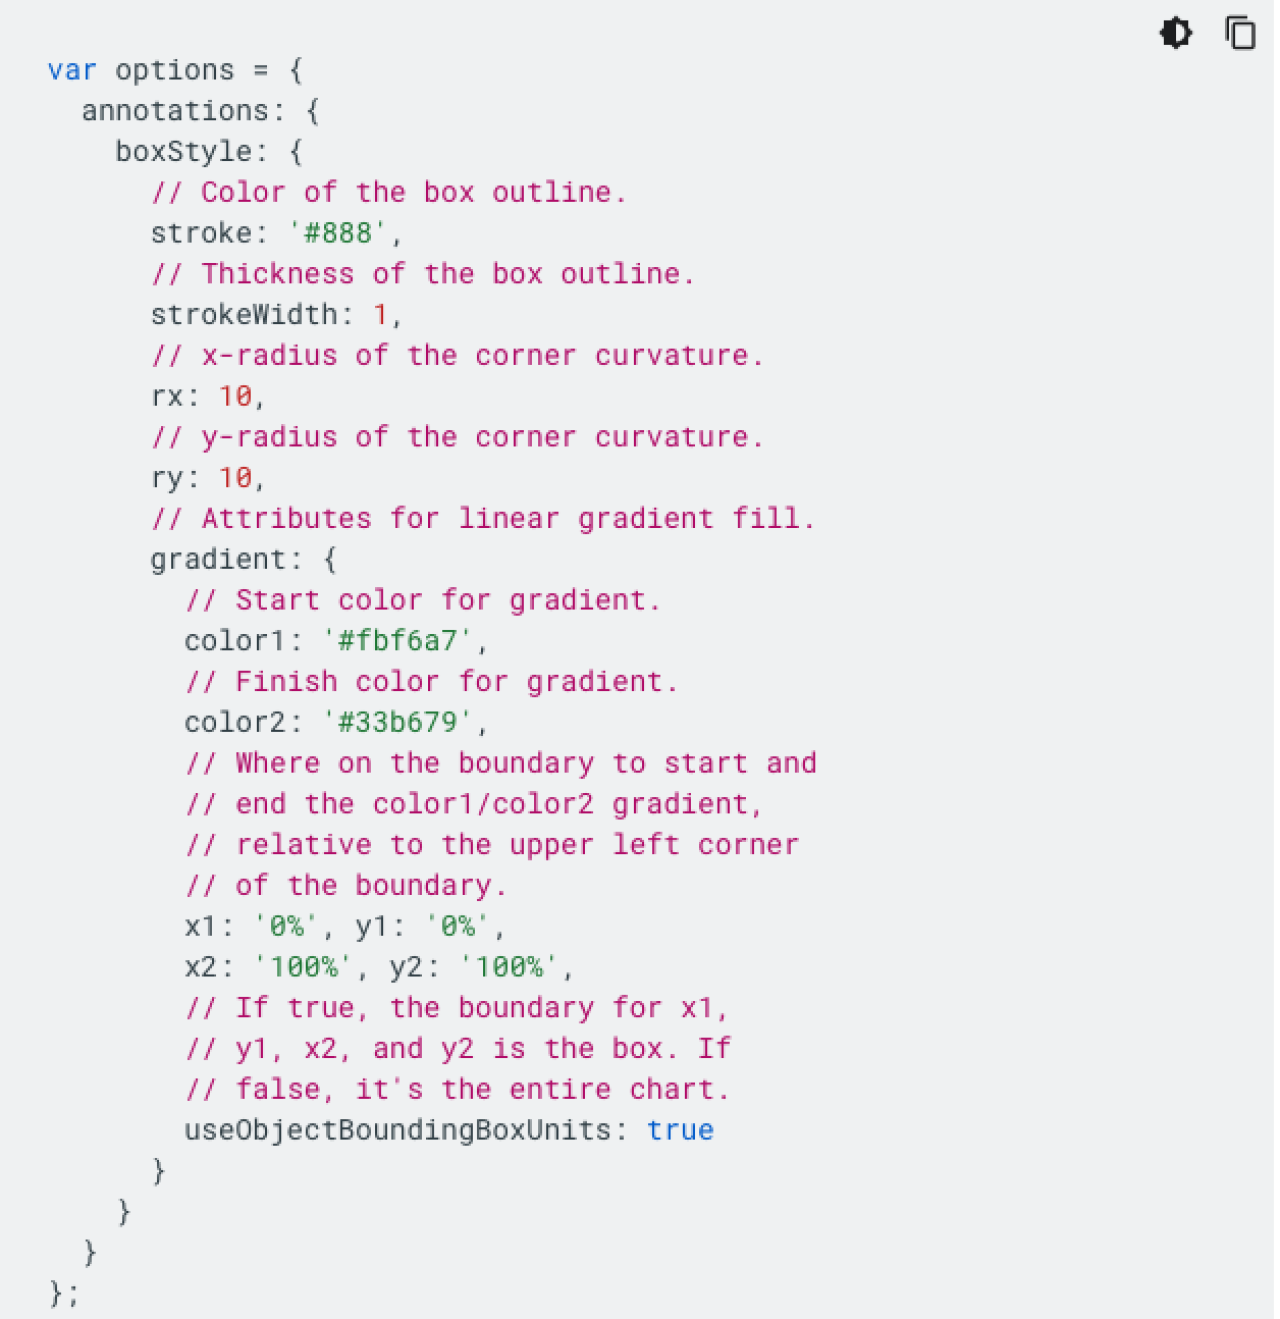
Styling Your Chart
Additionally, you can add many different CSS stylings to your chart to customize and enhance the way your users see the end result.
In the demo file, on the setup layout underneath the Header Data field, there is a CSS Stylings edit box for you to paste the CSS styles you want to apply to your chart. By default, it will style your chart to have a title and place the chart legend at the bottom of the chart. There are many ways to change the style, so if you want to learn more about all the CSS properties you can change about your graph, visit the Google Bar Chart documentation for configurations.
Conclusion
Google Charts is a powerful graphical visualization tool that you can use to generate dynamic, data-driven charts easily. Our demo file provides an easy-to-set-up method for quickly generating any of the 26 supported chart types by Google's library and provides the flexibility to adapt them to generate charts based on the data that is important to you. If you're interested in adding Google Charts to your FileMaker application or need help implementing them, contact us at DB Services.
Did you know we are an authorized reseller for Claris FileMaker Licensing?
Contact us to discuss upgrading your Claris FileMaker software.
Download the Filemaker Google Charts Integration File
Please complete the form below to download your FREE FileMaker file.